FCMOJUSTIN

TELEMEDICINE GROWTH / RESULTS WALKTHROUGH

TELEMEDICINE
GROWTH.
BACKED BY RESULTS.

Acquire new customers.
Know what they cost.
Scale with a clearer picture.

I’m Justin Ingram. I’ve been building telemedicine funnels, ads, and campaigns since 2020, backed by a decade in medical marketing. I connect strategy to execution across the entire customer journey.

Book a strategy call Watch the walkthrough ↓

JUSTIN INGRAM / EDITED RESULTS WALKTHROUGH

See the work.
Meet the person behind it.

A one-minute edit of Justin’s walkthrough, with original narration and anonymized reporting screenshots.

Published October 16, 2026. Selected healthcare and commerce engagements. Results belong to the accounts, periods, and reporting views shown. Client names and private account screens are omitted. Watch the earlier results walkthrough ↗

Results walkthrough: transcript and context.

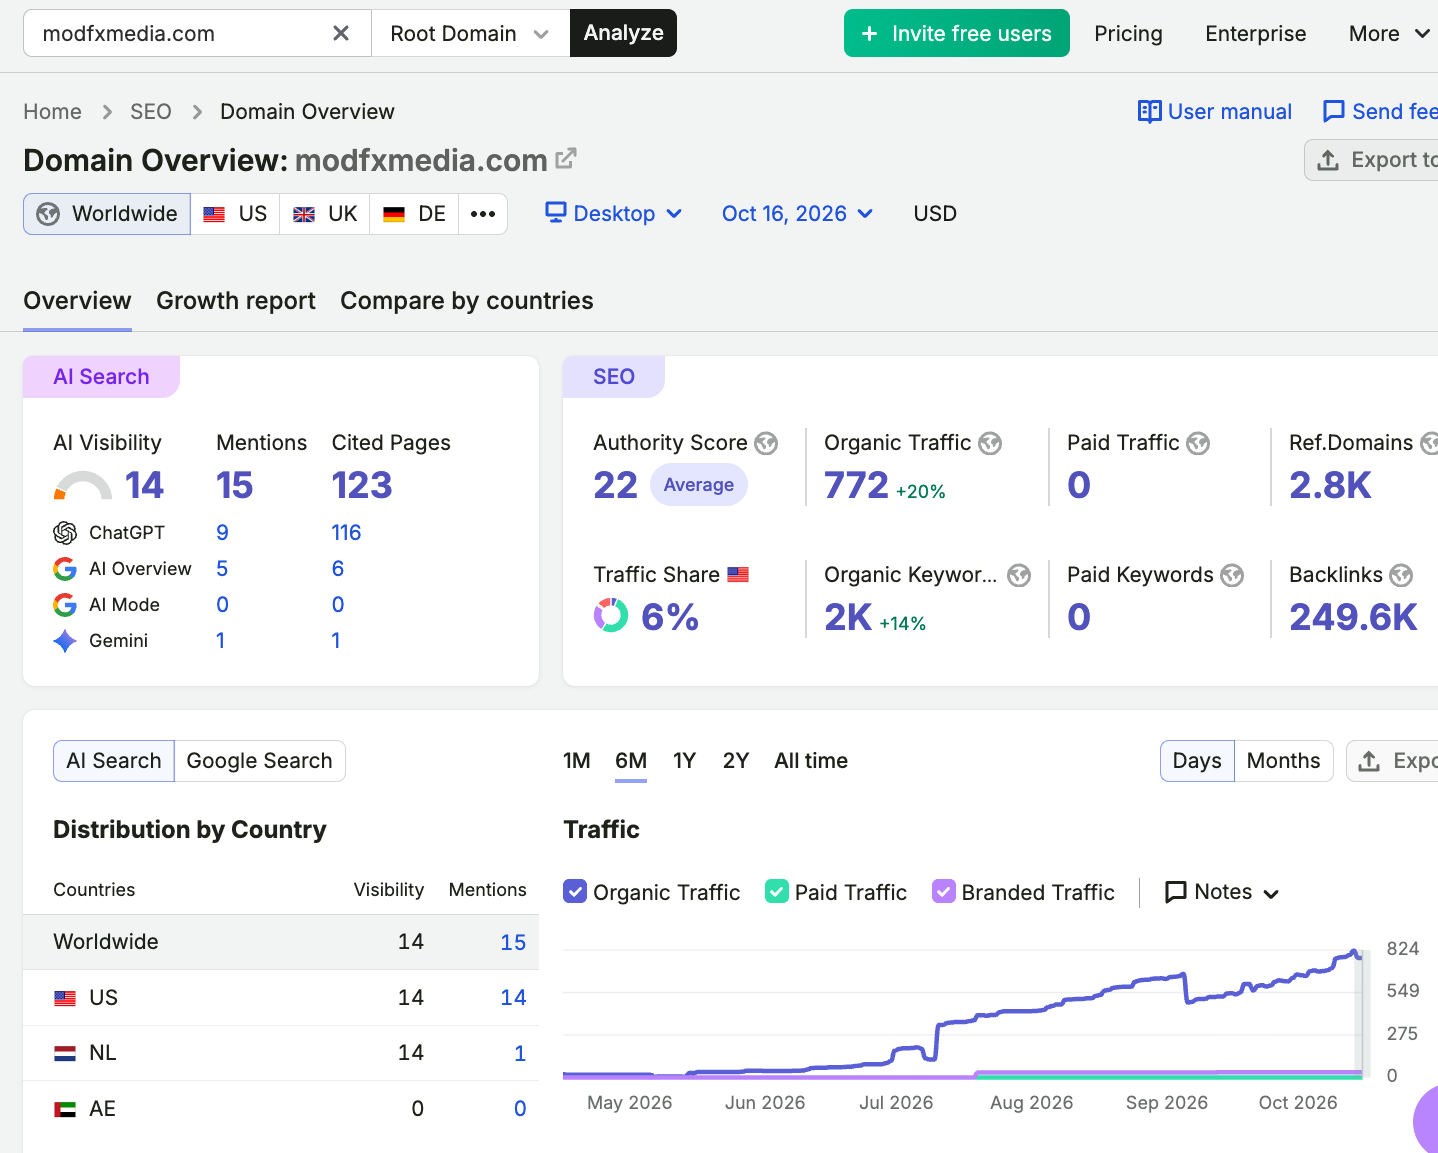
This is the transcript of the edited public video above. Bracketed lines describe on-screen text. The organic-search segment concerns research commerce; the acquisition dashboard is a separate reporting view.

[Selected results with Justin Ingram]

So I always say there's three things that we like to do for a telemedicine brand.

One is review the website and the storefront, make sure it looks great and has the programmatic SEO baked in.

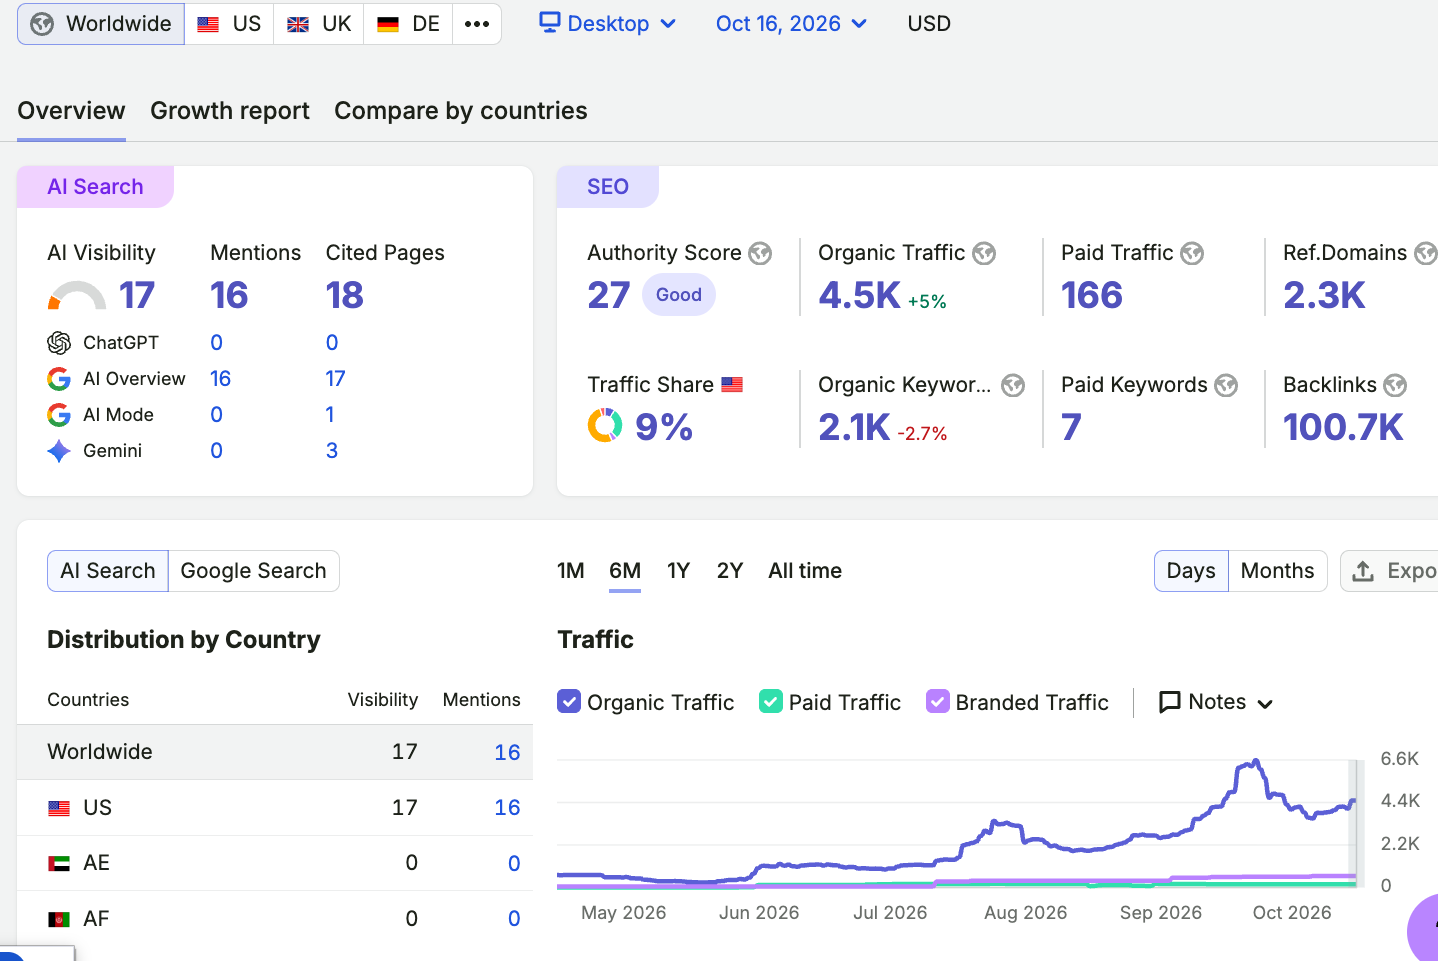
Six months of growth that we've had, going from 200 monthly visitors to average...

about four to five thousand monthly visitors over the last six months.

And the third thing that we do: we set up really strong AI, UGC, creative videos and static images.

We also help review the offer and make sure it's a really strong offer that's going to get conversions and it's going to get sales...

because we know what works and what doesn't work in this space.

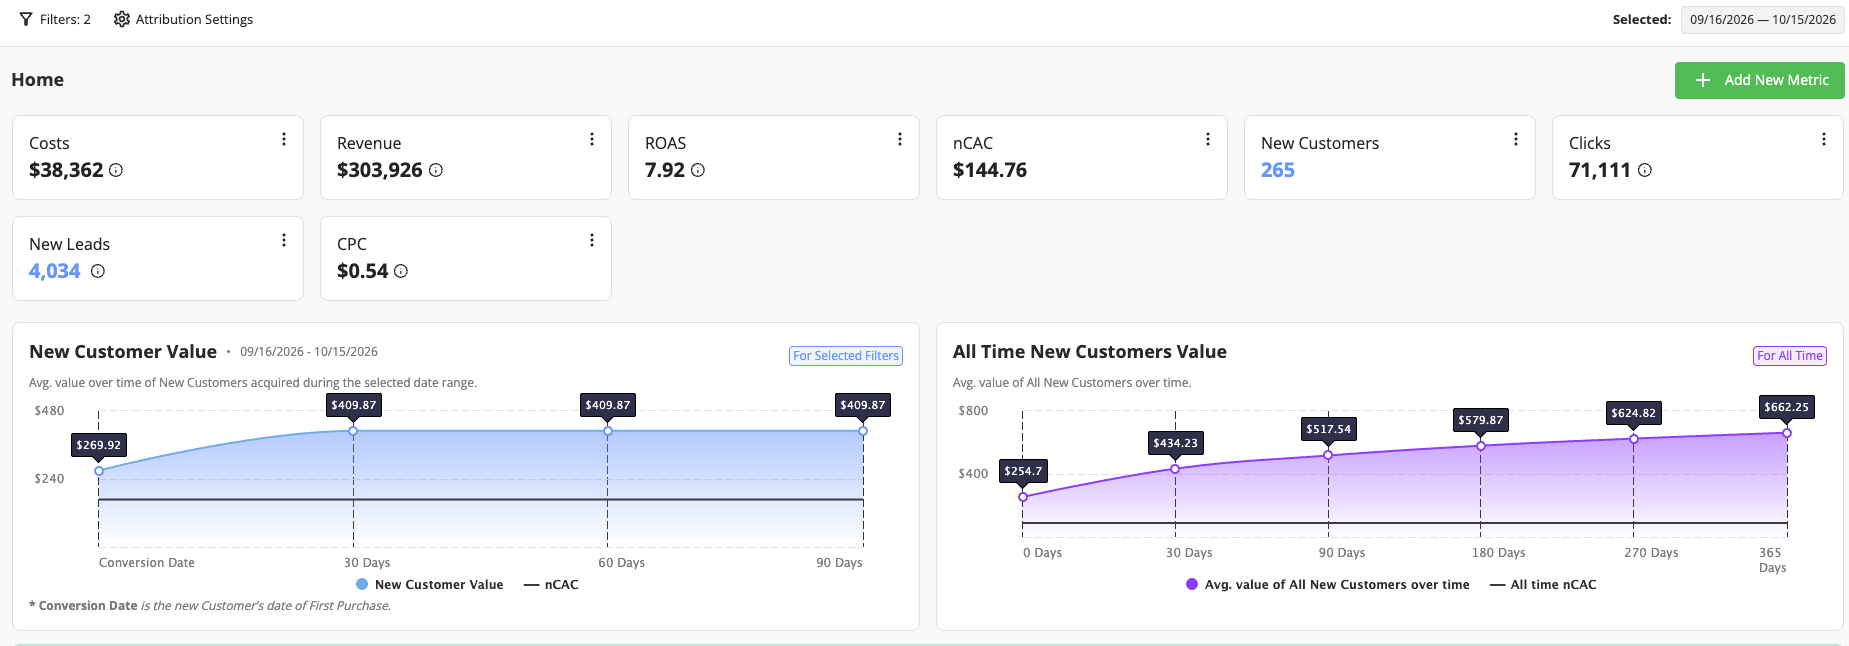
[Selected Wicked Reports view: 265 new customers. $144.76 blended acquisition cost. September 16–October 15, 2026.]

[Book a strategy call at fcmojustin.com]

Read the search case and measurement limits · Inspect the acquisition dashboard

MATT / IN HIS OWN WORDS

“JUSTIN HAS EXPLODED EVERY ONE OF OUR BUSINESSES HE’S EVER TOUCHED.”

A relationship built on the work.

Hear Matt describe his experience with Justin. Then see the campaigns, creative, funnels, and reporting behind the broader body of work.

See exactly how I help ↗
Matt / MODFX MEDIAWatch on Vimeo ↗

Matt’s published testimonial about his businesses. This is his experience, not a promise about every engagement. View the source ↗

SELECTED WINS / THE EVIDENCE BELOW

LET THE
WORK SPEAK.

Different accounts. Different measures.
One disciplined approach to growth.

ONE CONNECTED GROWTH SYSTEM

BUILD THE FOUNDATION.
CREATE DEMAND.
MEASURE THE BUSINESS.

The storefront & search.

Improve the offer, website, and conversion path. Build useful, structured search content around the business and the customer’s decision.

The paid-media engine.

Ad-account foundations, creative testing, Meta campaigns, and eligible Google Search or Shopping campaigns. Platform and product eligibility come first.

The full customer journey.

Connect the landing page, CRM, follow-up, checkout, and retention. Make the handoffs as deliberate as the campaign.

EXACTLY HOW I HELP

I BUILD THE ADS.
THE FUNNELS.
THE SYSTEM BEHIND THEM.

You get a senior marketing owner who sets the plan and stays close to execution. We choose the workstreams your business needs, agree on the deliverables, and give every next step an owner.

The offer & storefrontPeople land. The next step is unclear.

WHAT I DO

I review the offer, pricing presentation, website, landing pages, and path to consultation or checkout. Then I prioritize and build the changes that make that journey easier to follow.

WHAT YOUR TEAM GETS

Offer brief, page copy, funnel map, and a prioritized website build plan.

WHY IT MATTERS

A clearer path from interest to an appropriate action.

Funnels & conversion ↗
Creative & paid acquisitionYou need a repeatable way to test demand.

WHAT I DO

I develop concepts, scripts, UGC-style and AI-assisted creative, video and static ads, and the testing plan. I build and manage campaigns around the offer and downstream conversion quality.

WHAT YOUR TEAM GETS

Creative briefs and assets, campaign structure, test backlog, and performance reviews.

WHY IT MATTERS

Learn which messages bring useful inquiries and customers.

See a Meta campaign breakdown ↗
Accounts & launch foundationsAccess, setup, or disapprovals slow the work.

WHAT I DO

I organize business and ad accounts, permissions, domains, and launch requirements. I review ads and destinations with your advisers. Search and Shopping are scoped only where the product and business are eligible.

WHAT YOUR TEAM GETS

Account ownership map, access checklist, campaign QA, and issue-resolution priorities.

WHY IT MATTERS

Reduce avoidable setup friction and keep responsibility clear.

Advertising foundations ↗
Search & useful contentEvery new visit depends on buying another click.

WHAT I DO

I map search intent to your real services, build useful pages, improve site structure and internal links, and connect content to your offer. Programmatic publishing is used when each page has a distinct purpose.

WHAT YOUR TEAM GETS

Keyword-to-page map, content briefs, published pages, and indexing checks.

WHY IT MATTERS

Build another route for relevant prospects to discover you.

See the organic-search case ↗
CRM & follow-upThe inquiry arrives. The handoff breaks.

WHAT I DO

I map inquiry routing, pipeline stages, booking, follow-up, and team ownership. I coordinate the automations and integrations around the journey so the next action has an owner.

WHAT YOUR TEAM GETS

CRM stage definitions, follow-up workflows, routing rules, and handoff QA.

WHY IT MATTERS

Make it easier for the team to respond and see where opportunities stall.

Growth infrastructure ↗
Attribution & budget decisionsROAS looks good. New-customer cost is unclear.

WHAT I DO

I connect campaign, CRM, and purchase data—typically with Wicked Reports—to distinguish first-time customers from returning buyers. We compare paid, organic, and email contribution and decide what to test, fix, or fund next.

WHAT YOUR TEAM GETS

Tracking plan, permitted custom conversions, source conventions, reporting views, and reconciliation checks.

WHY IT MATTERS

Make budget decisions with clearer acquisition cost and customer value.

See 265 new customers in context ↗

My responsibility

Marketing direction, priorities, hands-on work within the agreed scope, coordination with your team, and a regular review of results.

Your team’s role

Provide access, approvals, service capacity, and business context. Your clinical and legal advisers own care decisions and required reviews.

The working rhythm

A prioritized backlog, agreed production and campaign scope, and a clear decision at each review: launch, improve, pause, or investigate.

Map the priorities for your brand ↗

A TYPICAL FIRST 90 DAYS / SCOPE AGREED TOGETHER

A CLEAR PLAN.
VISIBLE WORK.

FIRST 30 DAYS

Find the constraint.
Fix the foundations.

Review the offer, accounts, funnel, creative, CRM, and reporting. Establish the baseline and prioritize the changes that matter most.

You receive

A growth roadmap, measurement definitions, ownership map, and the first implementation priorities.

DAYS 31–60

Build the next test.
Connect the handoffs.

Launch the agreed creative, page, campaign, or follow-up work. Check the journey from first response to the relevant business outcome.

You receive

Live work within scope, a test log, tracking QA, and a review of conversion quality.

DAYS 61–90

Read the evidence.
Choose the next move.

Review acquisition cost, customer value, attribution gaps, and operating capacity. Expand what the evidence supports and revise what it does not.

You receive

A performance review, budget recommendations, and the next prioritized roadmap.

Timing depends on access, approvals, platform eligibility, and the agreed scope. This is a working approach, not a promised performance result.

ACQUISITION IS ONLY HALF THE PICTURE

KNOW WHAT
A NEW CUSTOMER
REALLY COSTS.

A returning buyer should never hide the cost of acquiring someone new.

I set up end-to-end attribution and tracking, typically with tools such as Wicked Reports, so we can separate first-time customers from repeat purchases and evaluate the channels driving each.

That connects paid media, organic search, email, the funnel, and the purchase history to a useful commercial view—not just the numbers inside an ad platform.

  • New-customer acquisition costDefine the first purchase, deduplicate customers, and separate new and returning buyers.
  • Channel contributionCompare paid, organic, email, and other sources within a consistent attribution model.
  • Customer value over timeReview repeat purchases, retention, and payback alongside acquisition cost.
  • Tracking foundationsAccount setup, UTMs, custom conversions, event mapping, and end-to-end QA.

Measurement depends on the connected data, consent, and attribution model. Patient or sensitive health information does not belong in advertising-platform events.

BO / HEALTH & WELLNESS ENTREPRENEUR

THEY BUILT OUR
ENTIRE GROWTH ENGINE.

Strategy. Systems. Execution.

“The systems Justin and his team built for us are second to none. They didn’t just run ads, they built an entire growth engine that compounds over time.”

One owner for the marketing plan. Connected work across creative, campaigns, the conversion journey, and follow-up. Bo describes what that relationship meant for his business.

Explore the infrastructure work ↗
Bo / MODFX MEDIAWatch on Vimeo ↗

Bo’s testimonial, as published by ModFX Media. The quote describes his experience with Justin and the team. View the source ↗

Explore all 15 reporting screenshots The full evidence collection ↓

Wicked Reports · channel report capture, Oct 16, 2026

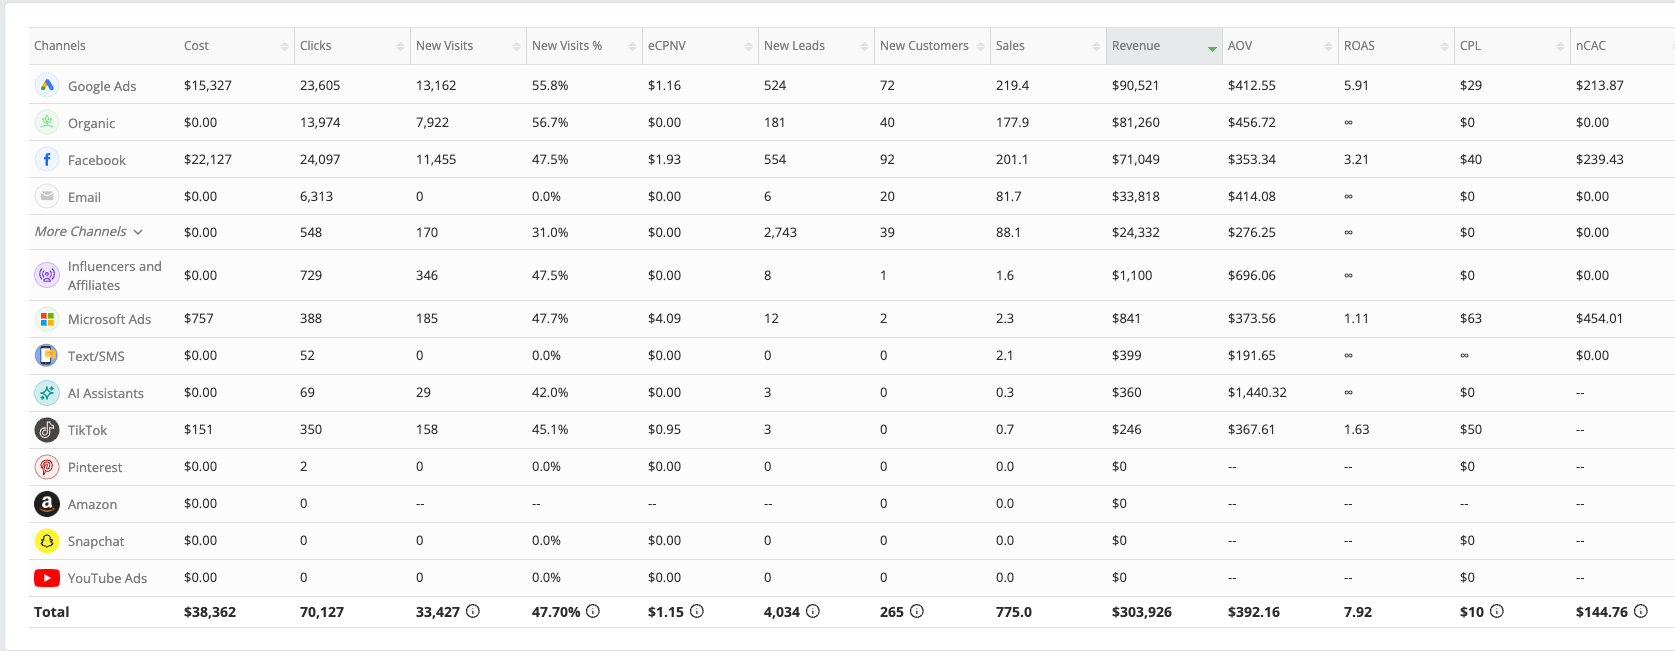
One commercial picture. Every channel in view.

Paid search, Meta, organic, and email—measured in the same report.

One commercial picture. Every channel in view. Paid search, Meta, organic, and email—measured in the same report.View full-size evidence
$90,521 Google revenue$81,260 organic revenue$33,818 email revenue

This report totals $303,926 revenue, $38,362 cost, and 265 new customers. Fractional sales values reflect the report’s attribution allocation. Channel credit differs from the other detail view. The screenshot does not show the date selector.

Wicked Reports · displayed cohort Sep 16–Oct 15, 2026

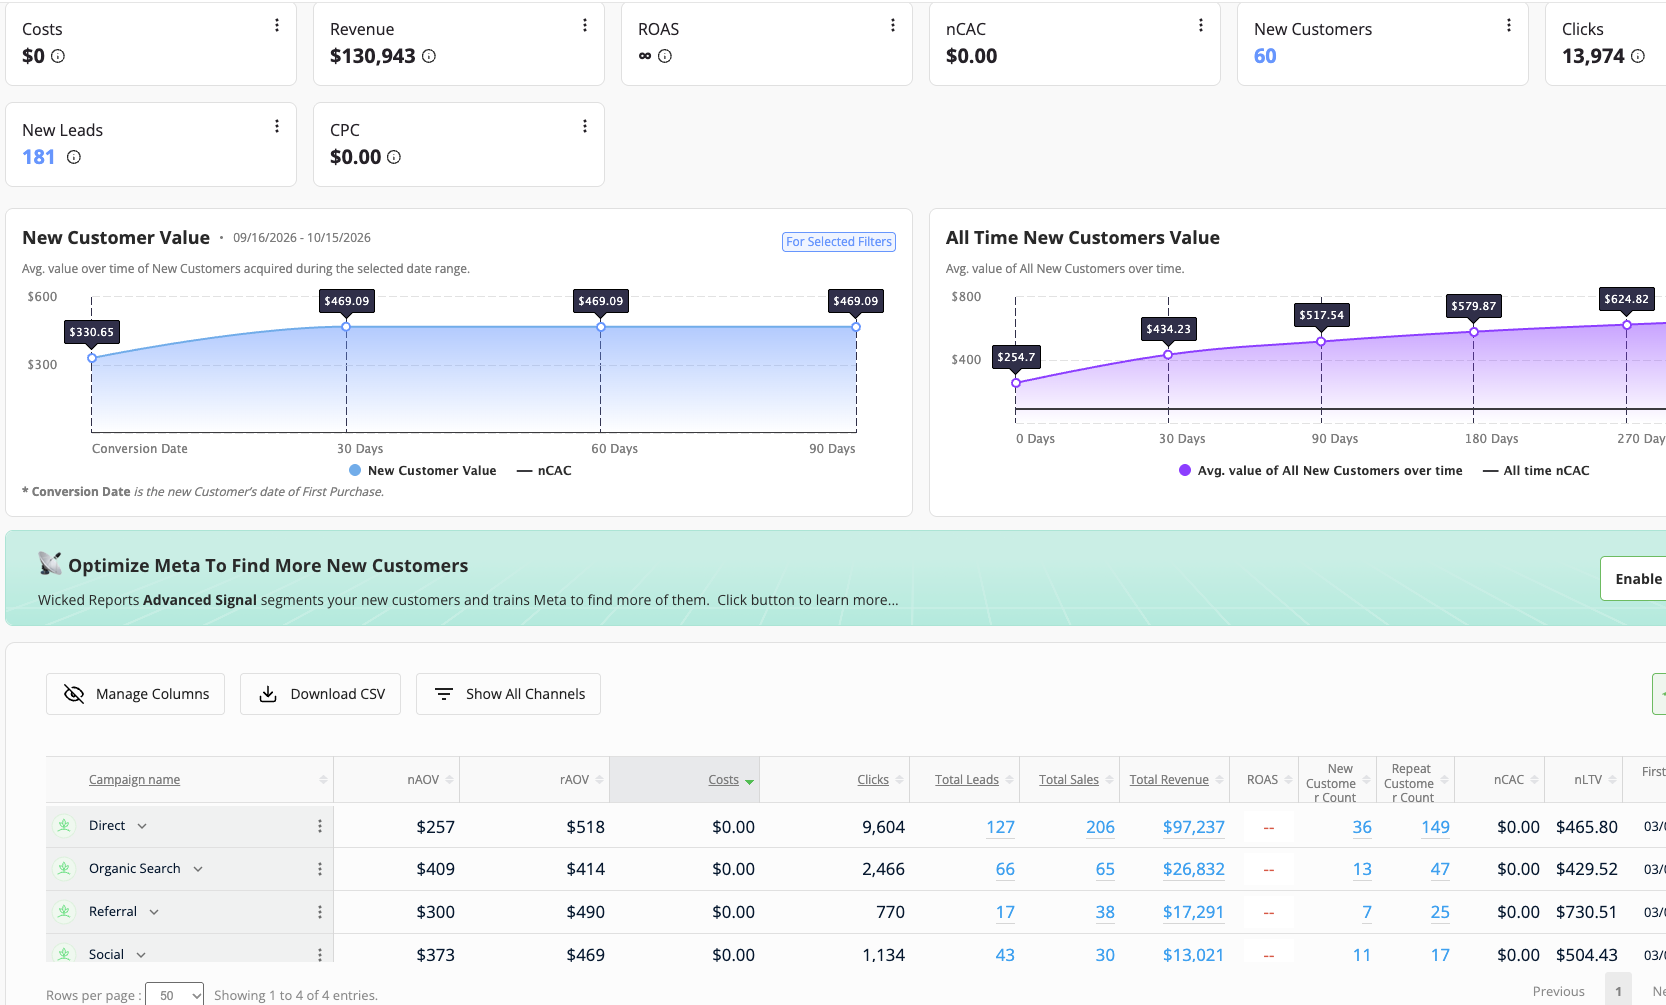
$130,943 in revenue in the selected non-paid view.

Follow first purchases into repeat customer value.

$130,943 in revenue in the selected non-paid view. Follow first purchases into repeat customer value.View full-size evidence
60 new customers181 new leads

The selected dashboard shows 60 new customers and 181 new leads. Zero recorded media cost does not mean these channels had no operating cost. Channel rows may overlap and should not be summed as unique customers.

Google Ads · campaign capture, Oct 16, 2026

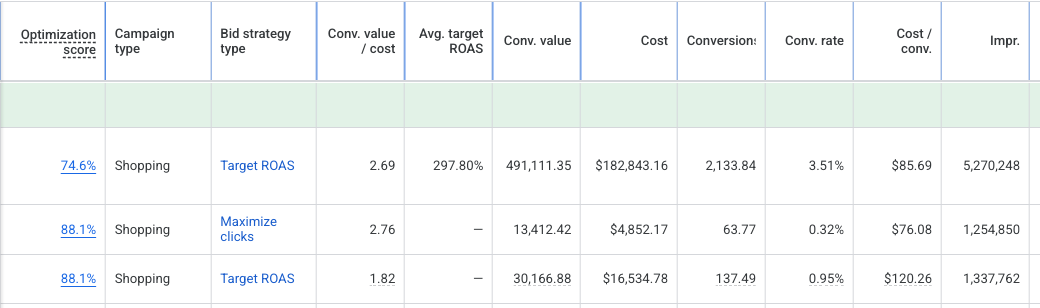
$491,111.35 in conversion value on one Shopping campaign.

2.69× conversion value / cost, with $182,843.16 in spend.

$491,111.35 in conversion value on one Shopping campaign. 2.69× conversion value / cost, with $182,843.16 in spend.View full-size evidence
$491,111.35 conversion value2.69× value / cost

The three displayed Shopping rows show costs per conversion of $85.69, $76.08, and $120.26. Conversion counts are fractional and are not verified unique new customers. The screenshot does not display its date range.

Meta Ads · Sep 16–Oct 15, 2026

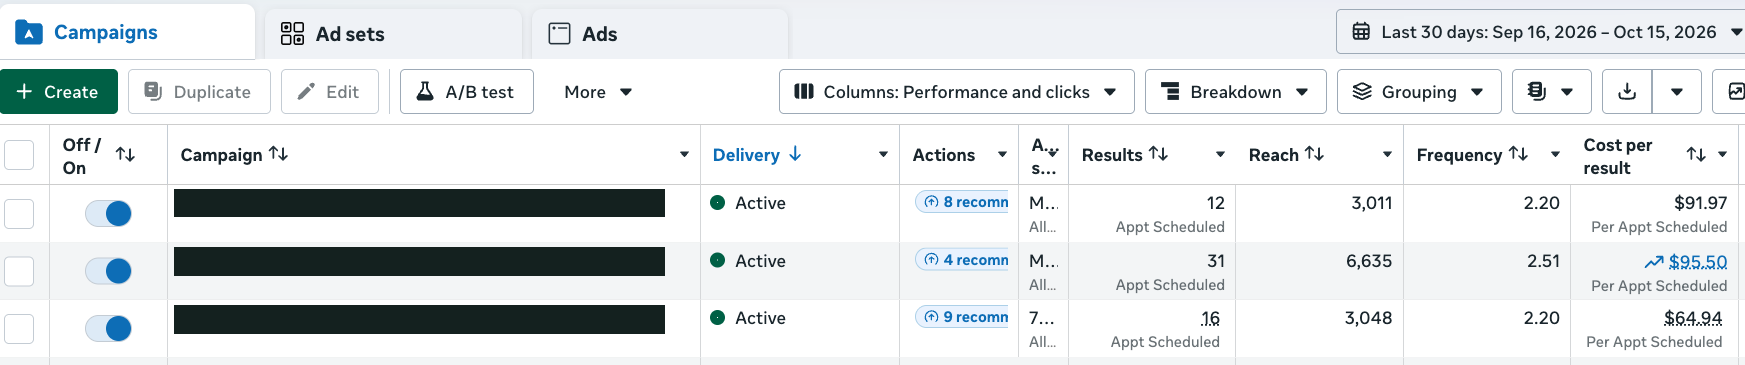
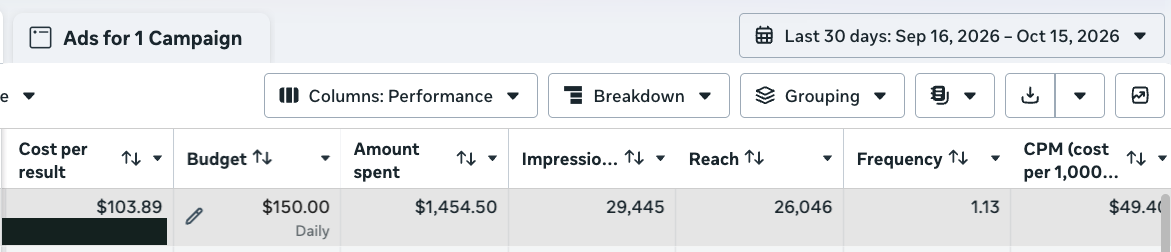
$103.89 per tracked conversion event.

A $1,454.50 spend snapshot with 29,445 impressions.

$103.89 per tracked conversion event. A $1,454.50 spend snapshot with 29,445 impressions.View full-size evidence
$103.89 cost per event$1,454.50 spend

This is a custom event reported by the platform. Its underlying customer definition is not established by the screenshot, so it is not presented as verified new-customer CAC. Identifying event code redacted.

Meta Ads · creative-test capture, Oct 16, 2026

Creative tests with visible conversion economics.

$99.99 and $156.62 per event across the two displayed tests.

Creative tests with visible conversion economics. $99.99 and $156.62 per event across the two displayed tests.View full-size evidence
2 events at $99.996 events at $156.62

The crop shows two and six custom events. Different event codes are used; the counts are not combined into a single acquisition metric. The date range is not visible. Identifying codes redacted.

Meta Ads · campaign capture, Oct 16, 2026

622 tracked events. $78,035.04 in spend.

A scaled Meta campaign reporting $125.46 per event.

622 tracked events. $78,035.04 in spend. A scaled Meta campaign reporting $125.46 per event.View full-size evidence
622 tracked events$125.46 per event

A second row reports 57 events at $100.25 each, and a third reports one at $87.49. These are custom conversion events. This overlaps the closer crop below and is not additional performance. The period is not visible in the supplied crop.

Meta Ads · alternate crop, Oct 16, 2026

A closer look at the same campaign economics.

622 events at $125.46. A second row at $100.25 per event.

A closer look at the same campaign economics. 622 events at $125.46. A second row at $100.25 per event.View full-size evidence
Same campaignsAlternate view

This is a second crop of the same 622-event and 57-event rows. Included for readability, not counted as another result. Identifying event codes redacted.

Google Ads · chart spans Q4 2015–Q4 2026

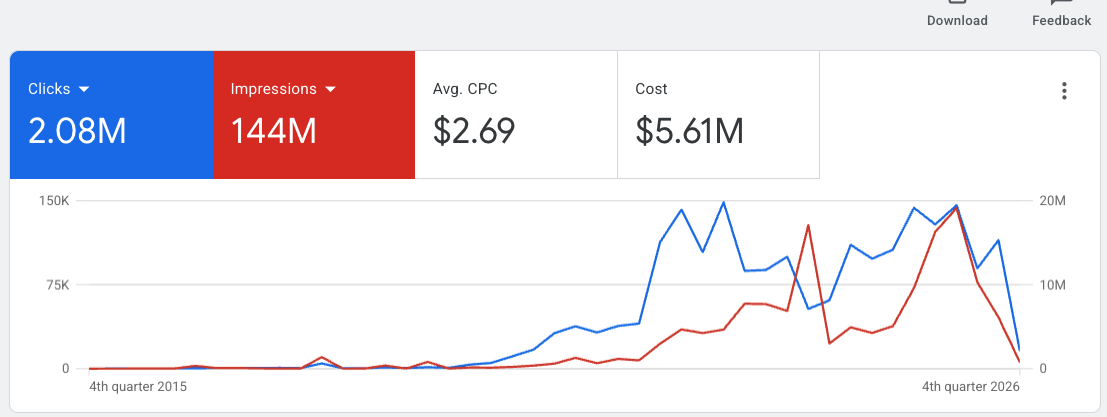
$5.61M in recorded Google Ads spend.

2.08M clicks and 144M impressions in the displayed historical view.

$5.61M in recorded Google Ads spend. 2.08M clicks and 144M impressions in the displayed historical view.View full-size evidence
$5.61M recorded spend2.08M clicks144M impressions

This is one supplied historical account view. It demonstrates media scale, not revenue, profit, or a claim that Justin personally managed every dollar across the entire chart. Rounded values appear as displayed.

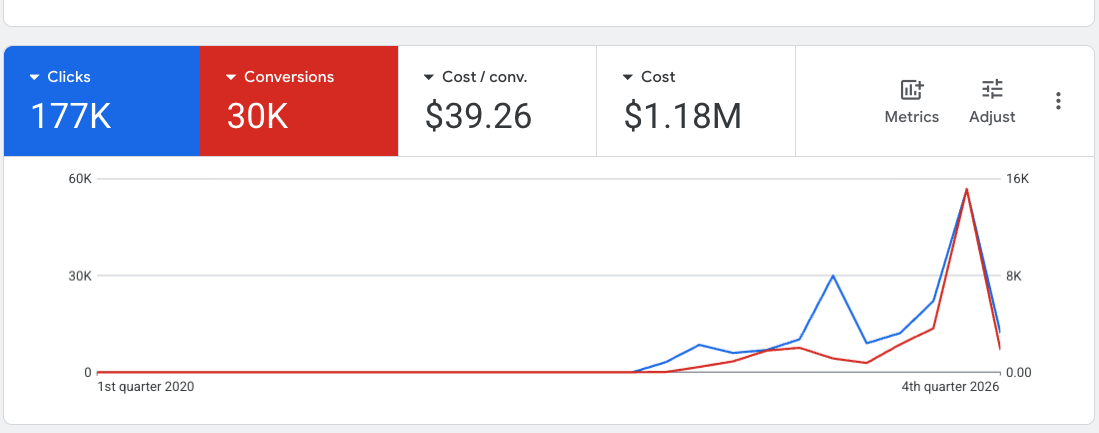
Google Ads · chart spans Q1 2020–Q4 2026

30K recorded conversions. $39.26 per conversion.

$1.18M in recorded spend in the displayed Google Ads view.

30K recorded conversions. $39.26 per conversion. $1.18M in recorded spend in the displayed Google Ads view.View full-size evidence
30K conversions$39.26 cost / conversion

The dashboard shows 177K clicks and rounded conversion and cost totals. Conversion actions may include more than one type of event; 30K is not a claim of 30K unique clients. Do not sum this spend with other account views.

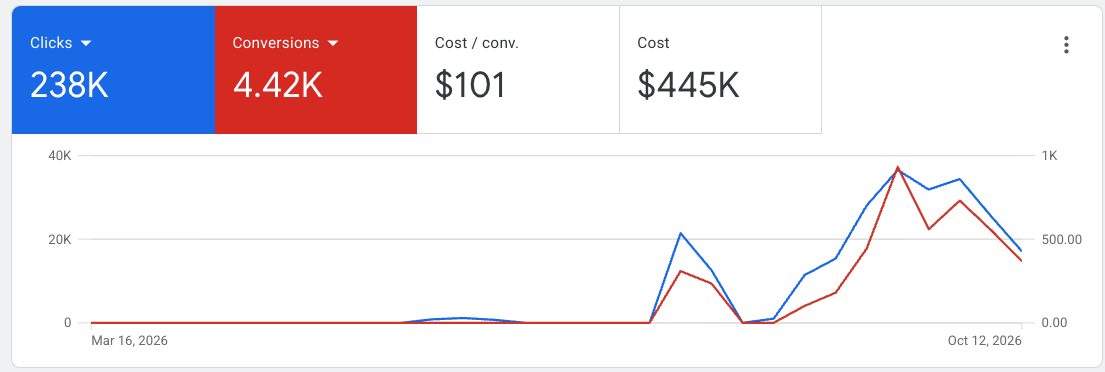
Google Ads · chart labels Mar 16–Oct 12, 2026

4.42K recorded conversions at $101 each.

$445K in spend and 238K clicks in the displayed Google Ads view.

4.42K recorded conversions at $101 each. $445K in spend and 238K clicks in the displayed Google Ads view.View full-size evidence
4.42K conversions$445K spend

Rounded platform-reported figures. The conversion definition is not shown; these are not independently verified patient or new-customer counts. This view may overlap other supplied Google Ads evidence.

The three featured images appear above; the remaining twelve are in this collection. Overlapping screenshots are labeled and never double-counted.

30 MINUTES / DIRECT WITH JUSTIN

LET’S FIND YOUR
NEXT GROWTH MOVE.

Bring your website, your stage, and the constraint. We’ll discuss where growth is getting stuck and whether fractional CMO leadership is the right fit.

Book a strategy call

A CLOSER LOOK

Questions behind the growth numbers

What does the $144.76 acquisition-cost example measure?

The anonymized September 16–October 15, 2026 dashboard reports 265 new customers and $38,362 in recorded costs, producing a $144.76 blended new-customer acquisition cost. It is not a paid-channel-only or fully loaded cost, a multi-client average, or a promised result for another brand.

Does the attributed revenue come only from new customers?

No. The reporting view includes repeat purchases, and the attributed revenue is not labeled as revenue exclusively from the 265 new customers. Attribution allocates credit under a model. The detailed case explains filters, overlapping views, and why this report is not an incrementality study or a profit calculation.