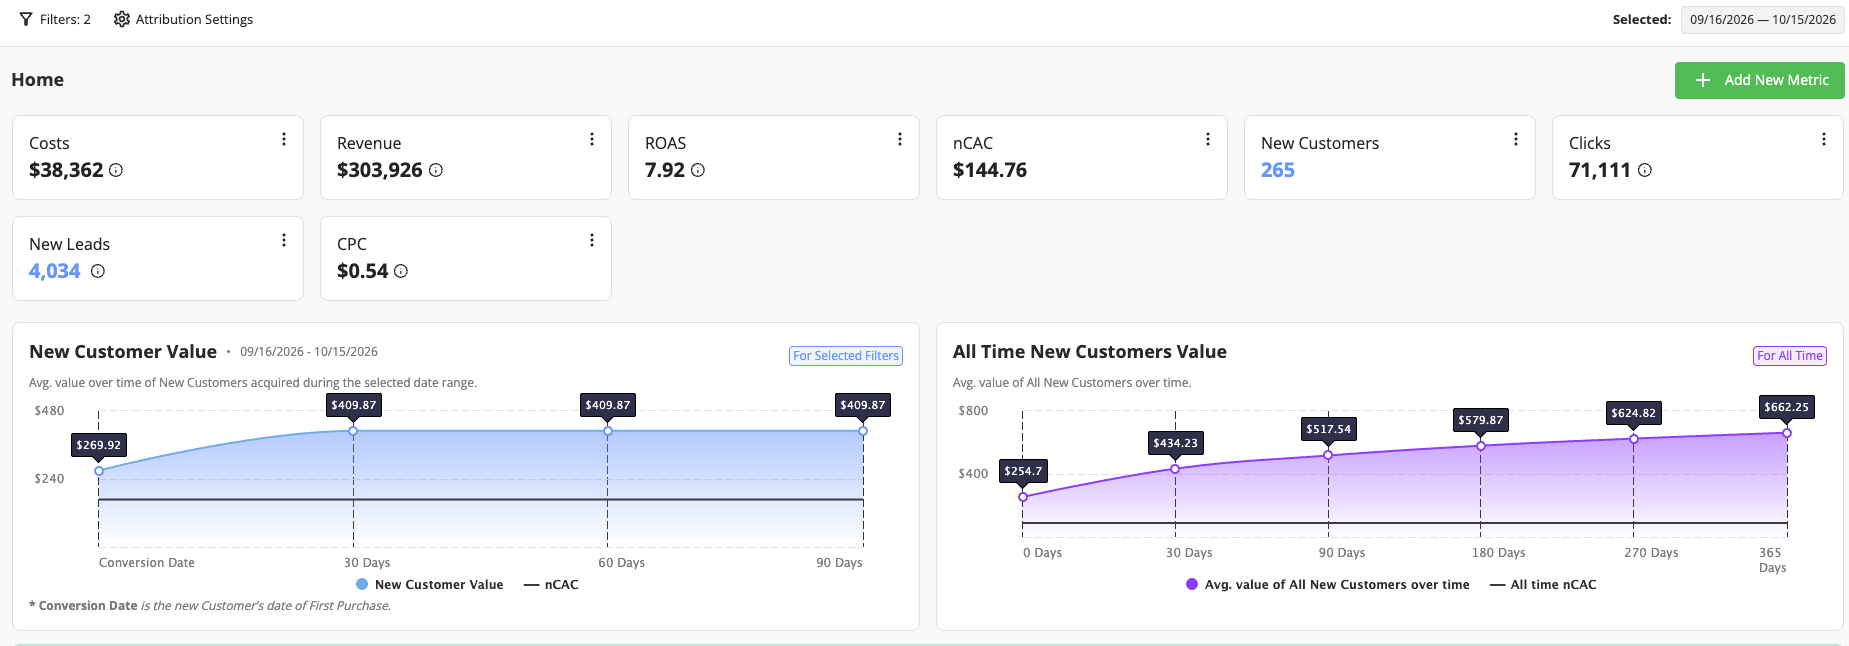
An anonymized account view connects $38,362 in recorded costs to 265 new customers and $303,926 in attributed revenue for September 16–October 15, 2026.
By Justin Ingram · Telehealth marketing strategist & fractional CMO · Updated October 17, 2026
The commercial question is not simply whether revenue increased. A founder needs to know how much acquisition costs for a first-time customer, how repeat purchases contribute, and why channel reports can tell different stories. This example documents those distinctions in the supplied Wicked Reports views.
WHAT I BRING TO THE WORK
The work around the result.
I set up end-to-end attribution, typically with Wicked Reports, to separate first-time customers from returning buyers and compare paid media, organic search, email, and other sources. That includes defining the customer events, connecting the data, and validating the reporting view. Here, the supplied dashboards show the outputs we use to discuss acquisition cost and repeat value. They do not establish a before-and-after lift caused by tracking alone.
FROM REPORTING TO DECISIONS
Separate new from returning customers
The primary dashboard reports 265 new customers. The $144.76 nCAC is a blended cost across the selected view, not a promise of the same acquisition cost for each paid channel.
Keep revenue and acquisition distinct
$303,926 is attributed revenue in the reporting view. It is not labeled as revenue exclusively from those 265 new customers. Repeat purchases and the revenue basis must remain visible when evaluating return.
Choose a consistent attribution view
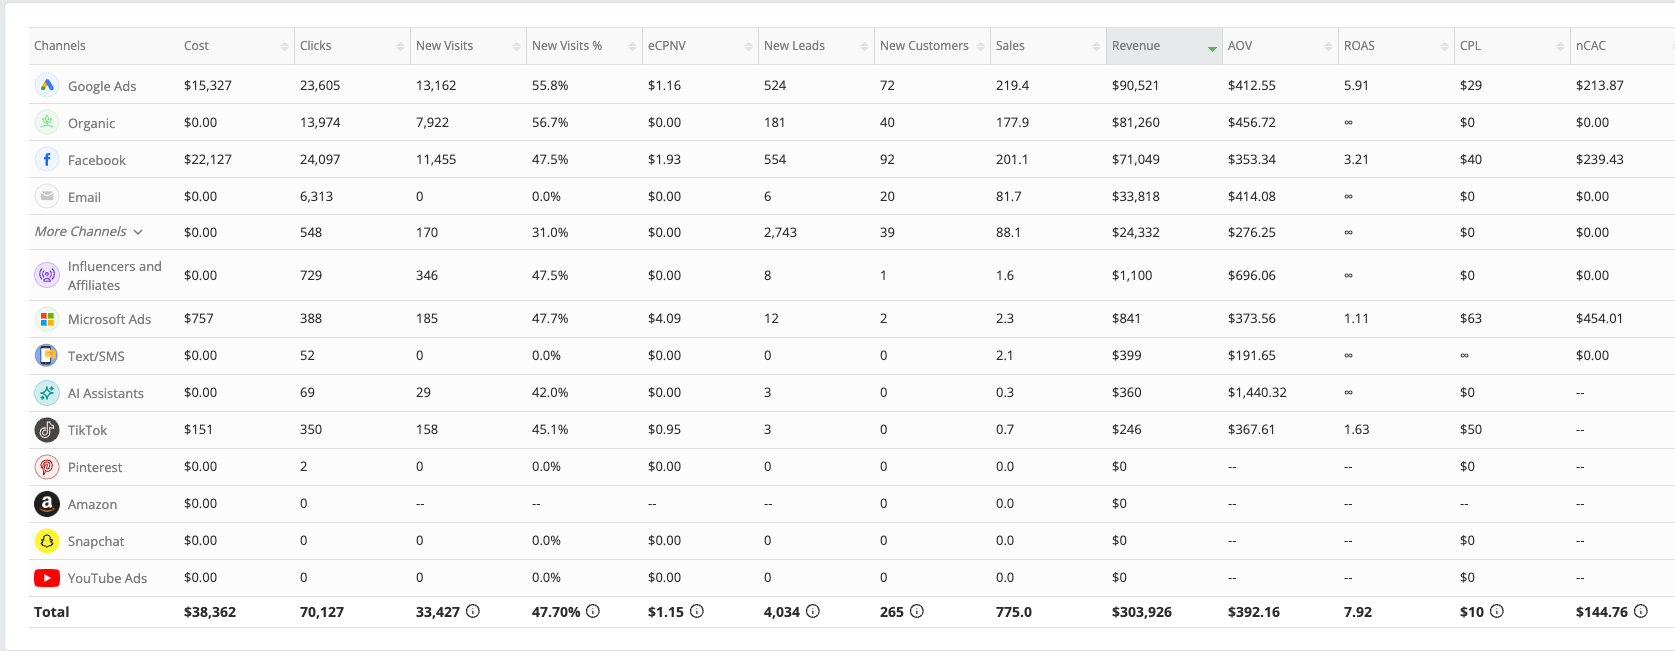
The detailed Google and Facebook view allocates different credit than the all-channel report. Both are supplied as evidence, with the differences stated. Combining their customer counts or revenues would double-count reporting views.
Use customer value to inform the next investment
The customer-value charts show why a first purchase is not the end of the commercial story. Review acquisition cost, repeat value, and payback together before deciding how much more to spend.
Wicked Reports · Sep 16–Oct 15, 2026
265 new customers. $144.76 blended acquisition cost.
$303,926 in attributed revenue against $38,362 in recorded costs.
265 new customers$144.76 blended nCAC$303,926 revenue
The dashboard reports 265 new customers and 7.92× revenue-to-cost across its selected view. Revenue can include repeat purchases; this is not new-customer-only revenue or profit. Two filters are shown; their definitions are not visible.
Wicked Reports · channel detail capture, Oct 16, 2026
Google and Meta. New customers measured separately.
81 Google Ads new customers. 106 Facebook new customers in this view.
Google Ads: $189.22 nCAC and 7.90 ROAS. Facebook: $208.75 nCAC and 4.51 ROAS. This channel-detail view differs from the all-channel report below; do not add the two views. The crop does not show the date range.
Wicked Reports · channel report capture, Oct 16, 2026
One commercial picture. Every channel in view.
Paid search, Meta, organic, and email—measured in the same report.
$90,521 Google revenue$81,260 organic revenue$33,818 email revenue
This report totals $303,926 revenue, $38,362 cost, and 265 new customers. Fractional sales values reflect the report’s attribution allocation. Channel credit differs from the other detail view. The screenshot does not show the date selector.
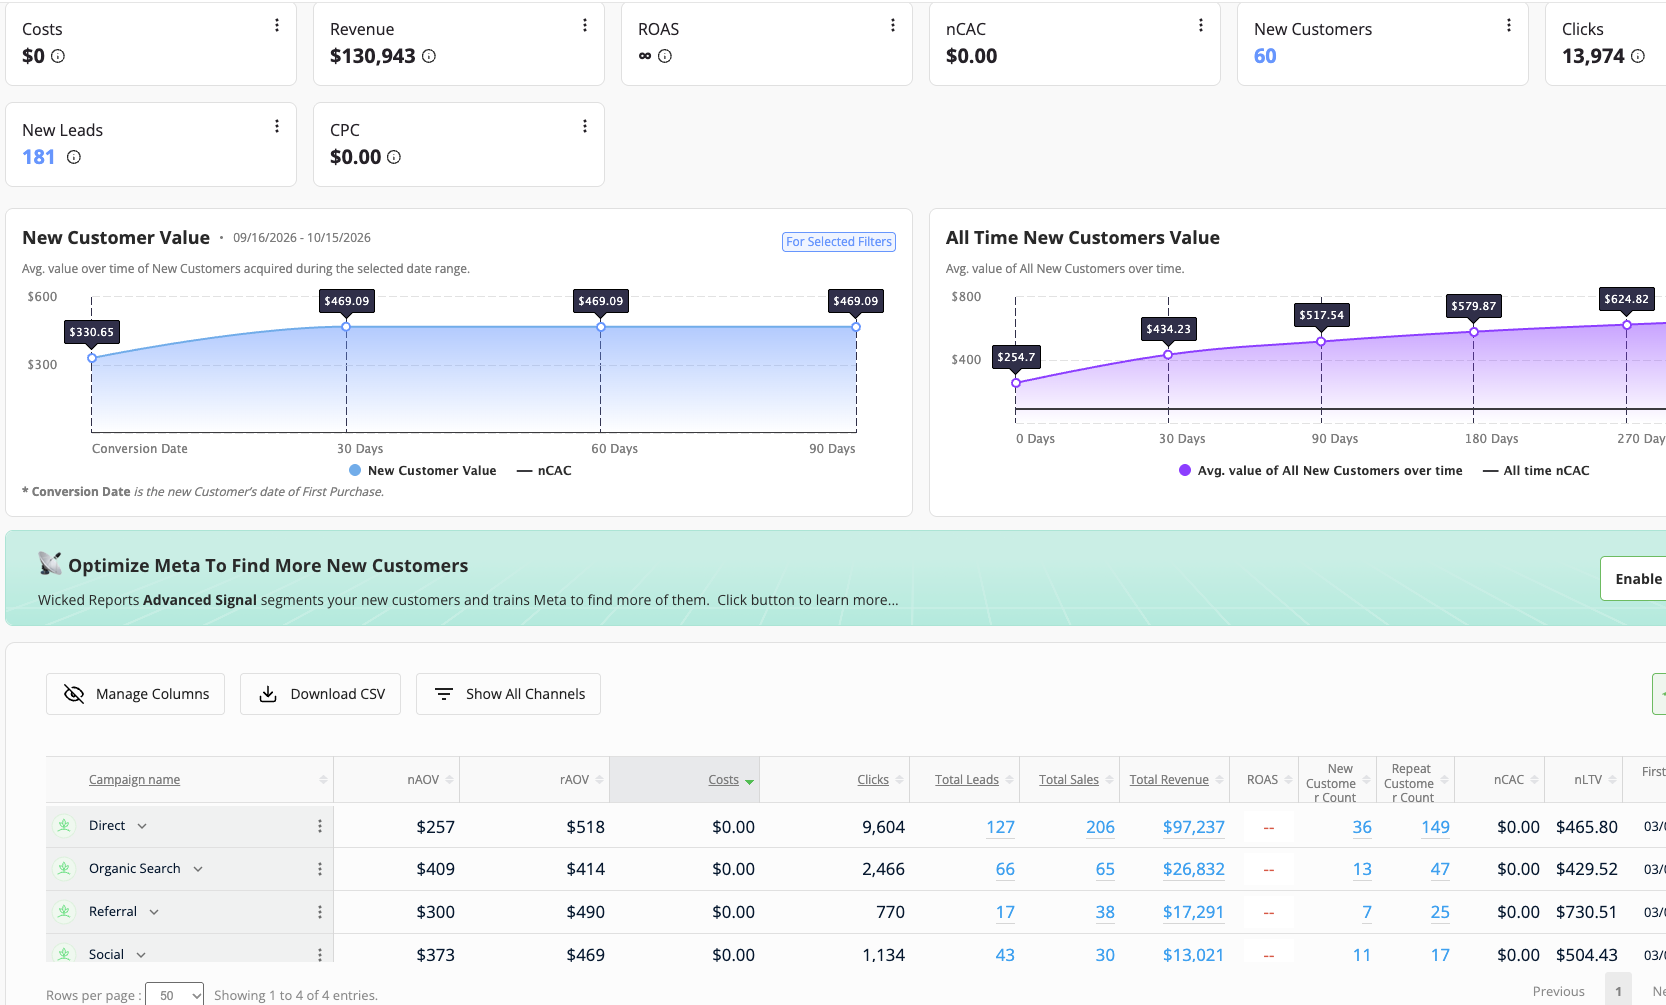
The selected dashboard shows 60 new customers and 181 new leads. Zero recorded media cost does not mean these channels had no operating cost. Channel rows may overlap and should not be summed as unique customers.
Source and measurement.
The primary dashboard shows two filters whose definitions are not visible. Other crops do not display a date selector. Attribution assigns credit under a model; it is not an incrementality study or a profit calculation. No client identity or patient information is published.
Source material: Justin’s October 16, 2026 walkthrough and supplied reporting screenshots. Client identities are withheld; the ModFX example identifies Justin’s own agency. Original metrics are preserved; duplicate views are not counted as additional performance.
These services address the work illustrated by this case. The service link describes a capability, not a promise of the same result or a claim that this case belongs to every niche served.
An anonymized account view connects $38,362 in recorded costs to 265 new customers and $303,926 in attributed revenue for September 16–October 15, 2026.
What are the measurement limits of this example?+
The primary dashboard shows two filters whose definitions are not visible. Other crops do not display a date selector. Attribution assigns credit under a model; it is not an incrementality study or a profit calculation. No client identity or patient information is published.
THE NEXT CHAPTER IS YOURS
LET’S MAKE GROWTH HAPPEN.
Tell me what you’re building. And what’s standing in the way.