THE BUSINESS CONTEXT
What the report helps us understand.
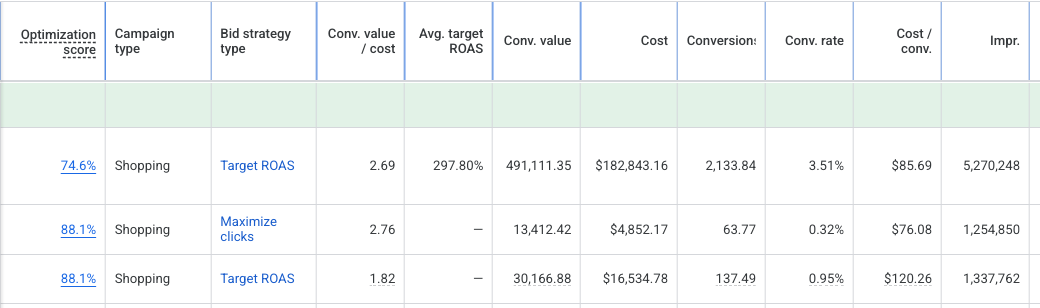
This reporting view makes the scale and economics of a Shopping campaign visible together. The largest row shows 5,270,248 impressions alongside spend, conversion value, and cost per conversion. The commercial question is whether the value being recorded supports the business after product costs, fulfillment, refunds, and repeat purchases are understood.
WHAT I BRING TO THE WORK
The work around the result.
In my walkthrough, I describe reviewing the website and storefront, preparing Merchant Center and product information where eligible, and building Shopping campaigns around the offer. Those are the capabilities I bring to this workstream. This screenshot documents campaign reporting; it does not establish that a specific feed change or landing-page edit caused the result.
FROM REPORTING TO DECISIONS
Read spend and conversion value together
The featured row reports $491,111.35 conversion value, $182,843.16 cost, and 2.69 conversion value per unit of cost. Conversion value is the value configured and attributed in Google Ads. It should be reconciled to business records before it becomes a claim about collected revenue or profitability.
Know what a conversion means
The row displays 2,133.84 conversions and $85.69 cost per conversion. Fractional attribution is visible. The screenshot does not identify the conversion actions or whether the buyers are new, so $85.69 is a platform cost per conversion rather than verified new-customer CAC.
Compare the other rows before choosing a budget
Two additional Shopping rows display $76.08 and $120.26 cost per conversion. They have different bid strategies and reporting economics. A useful review asks about the conversion action, product economics, reporting window, and customer mix before recommending a budget shift.
Connect the campaign to the rest of the journey
My work around Shopping includes offer and storefront review, product-data preparation, campaign structure, creative where applicable, and measurement. I use that connected view to investigate whether the next constraint is demand, the destination, checkout, or the quality of the conversion data.