Paid acquisition, organic visibility, and customer economics from selected healthcare, telemedicine, and research-commerce work. Every result comes with its source and context.
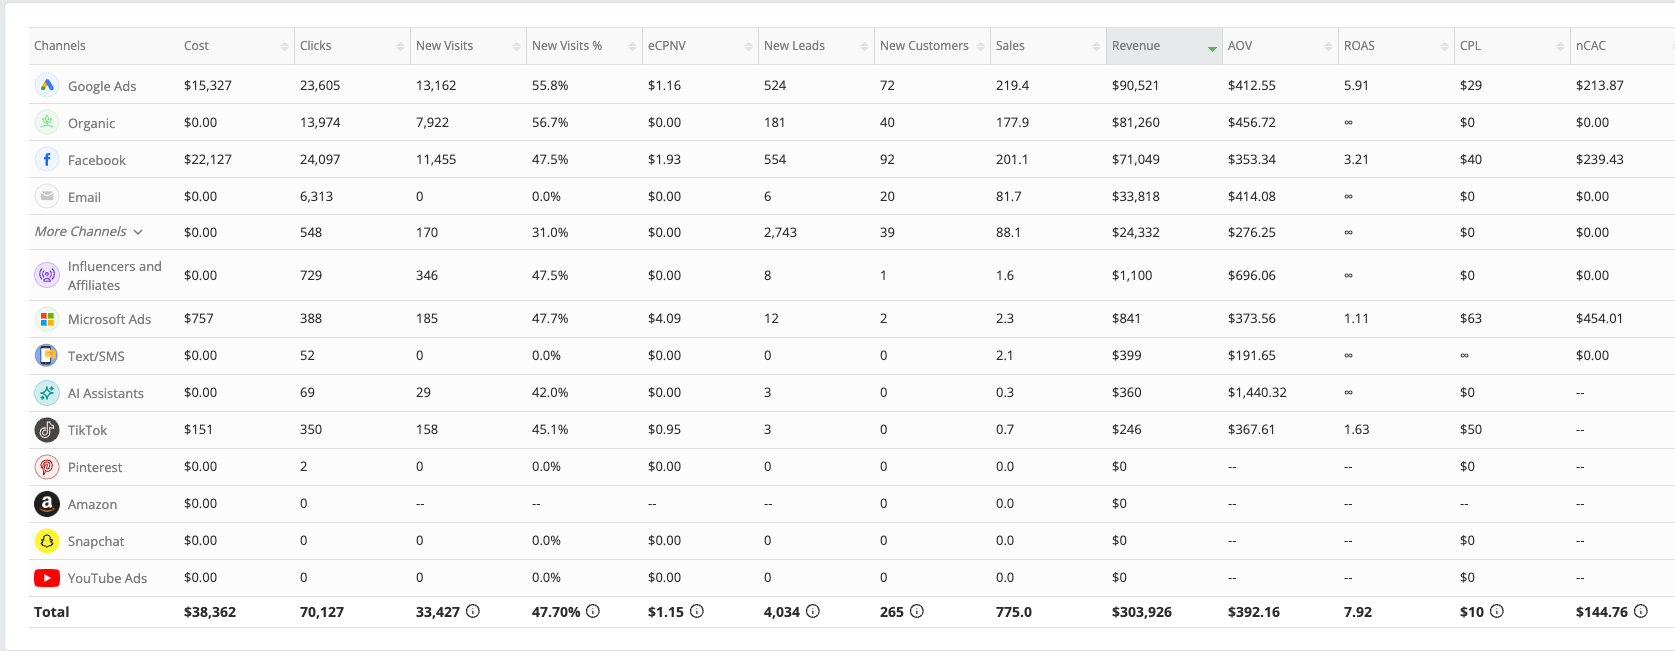
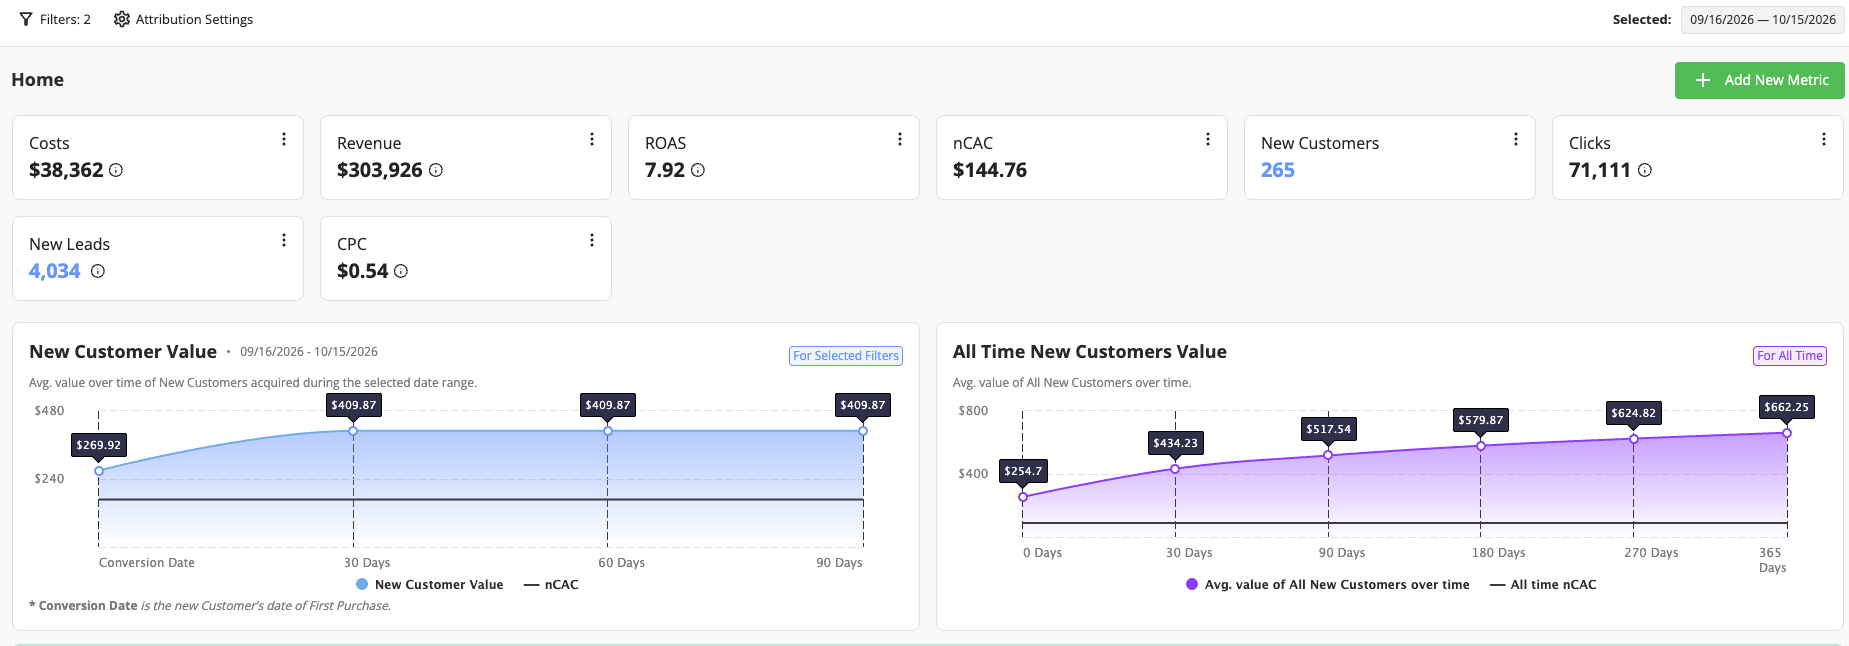
265 new customers$144.76 blended nCAC$303,926 revenue
The dashboard reports 265 new customers and 7.92× revenue-to-cost across its selected view. Revenue can include repeat purchases; this is not new-customer-only revenue or profit. Two filters are shown; their definitions are not visible.
Read the results clearly.
Platform conversions, scheduled appointments, and new customers are different measures. Separate attribution views can assign different credit. The screenshots below are evidence from specific accounts and periods; they are not additive or a promise of future performance.
MATT / IN HIS OWN WORDS
“JUSTIN HAS EXPLODED EVERY ONE OF OUR BUSINESSES HE’S EVER TOUCHED.”
A relationship built on the work.
Hear Matt describe his experience with Justin. Then see the campaigns, creative, funnels, and reporting behind the broader body of work.
ModFX reports $70,000 in revenue from one campaign in a single month. Calendar dates, ad spend, and profit are not provided on the source page. View the source ↗
MODFX-PUBLISHED WEBSITE RESULT
$20,000.Directly from the website.
The website has a job to do after someone clicks. This companion story focuses on the revenue attributed to that destination in one month.
ModFX reports $20,000 in website-attributed revenue in a single month. These separate clips are not combined into a total or represented as profit. View the source ↗
What I help you build
A clear offer, ads that introduce it, a page that makes the next step obvious, and tracking that connects the response to the business.
Sunny’s video sits alongside Health Elevated’s documented campaign checkpoints: audience acquisition, live attendance, and a later client-reported sales milestone.
Approximately 4,300 leads and 700 live attendees were reported at the October 7 checkpoint. The source publishes Sunny’s video under “$400k/month from Webinars”; that revenue headline is not independently reconciled by the dated lead, attendance, or sales records shown here. View the source ↗
BO / HEALTH & WELLNESS ENTREPRENEUR
THEY BUILT OUR ENTIRE GROWTH ENGINE.
Strategy. Systems. Execution.
“The systems Justin and his team built for us are second to none. They didn’t just run ads, they built an entire growth engine that compounds over time.”
One owner for the marketing plan. Connected work across creative, campaigns, the conversion journey, and follow-up. Bo describes what that relationship meant for his business.
“ModFX outdid themselves to help pull us out of a ditch, bringing in patients who are qualified, who have problems they're looking to solve, and who can actually afford to fix them.”
“ModFX Media has been legit. They've been with me every step through this process of making this business grow. I've referred Justin to several friends around the country.”
“The results speak for themselves. ModFX built us a system that consistently generates high-quality leads on autopilot. I wish I had found them years ago.”
“Working with ModFX transformed how we approach client acquisition. Our calendar is consistently full and the quality of leads is exactly what we were looking for.”
“After working with several agencies, ModFX is in a different league entirely. They genuinely care about your results and they know exactly what they are doing.”
Dr. Brett
From uneven demand to a more predictable pipeline.
“ModFX delivered where other agencies couldn't, a steady stream of qualified patients and a clear return on every dollar we invested.”
Videos and accompanying testimonial excerpts from ModFX Media’s public results page. These accounts describe individual experiences; they do not establish an average result. View the source ↗
THE WORK, EXPLAINED
RESULTS WITH A REASON TO MATTER.
See the work behind the report and what it can tell a founder. These include client engagements, campaign breakdowns, and an agency-owned example.
Separate reporting views are not additive. These six stories do not represent six distinct new clients. Each page identifies its source, period, and metric definitions.
REVENUE & ATTRIBUTION
New customers. Repeat revenue. Clearer decisions.
Wicked Reports · channel detail capture, Oct 16, 2026
Google and Meta. New customers measured separately.
81 Google Ads new customers. 106 Facebook new customers in this view.
Google Ads: $189.22 nCAC and 7.90 ROAS. Facebook: $208.75 nCAC and 4.51 ROAS. This channel-detail view differs from the all-channel report below; do not add the two views. The crop does not show the date range.
Wicked Reports · channel report capture, Oct 16, 2026
One commercial picture. Every channel in view.
Paid search, Meta, organic, and email—measured in the same report.
$90,521 Google revenue$81,260 organic revenue$33,818 email revenue
This report totals $303,926 revenue, $38,362 cost, and 265 new customers. Fractional sales values reflect the report’s attribution allocation. Channel credit differs from the other detail view. The screenshot does not show the date selector.
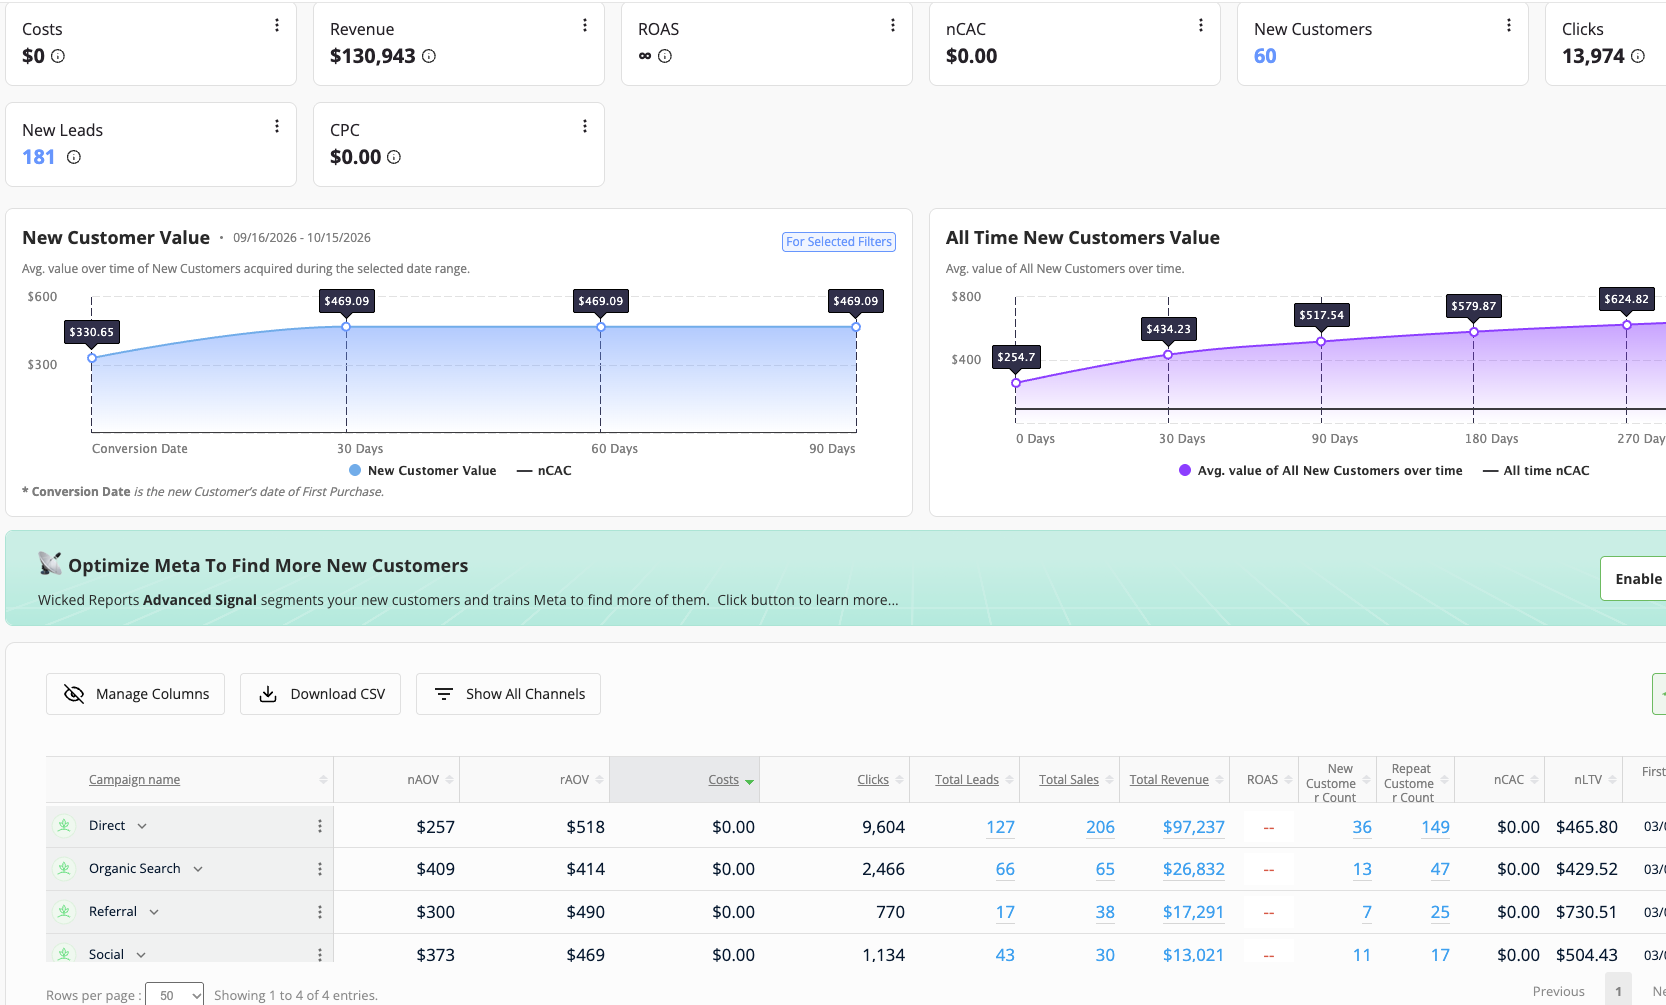
The selected dashboard shows 60 new customers and 181 new leads. Zero recorded media cost does not mean these channels had no operating cost. Channel rows may overlap and should not be summed as unique customers.
PAID ACQUISITION
The cost of the next conversion.
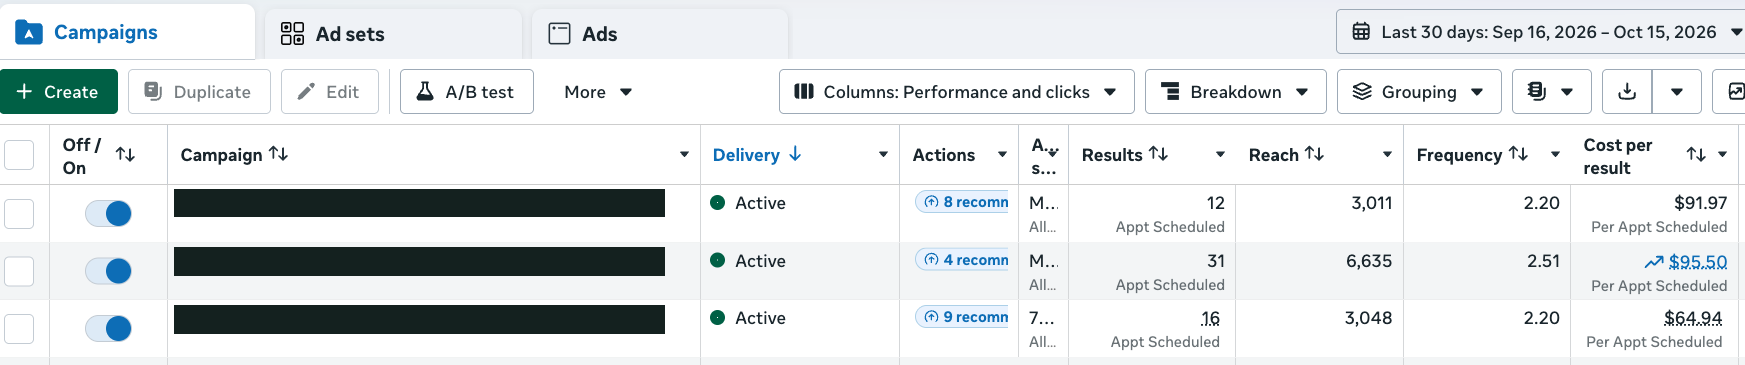
Meta Ads · Sep 16–Oct 15, 2026
59 scheduled appointments across three campaigns.
The lowest displayed cost per scheduled appointment: $64.94.
The three rows show 12, 31, and 16 appointment events, totaling 59 reported events. Costs per result are $91.97, $95.50, and $64.94. Appointments are not verified attended visits or unique acquired clients. Campaign names are redacted.
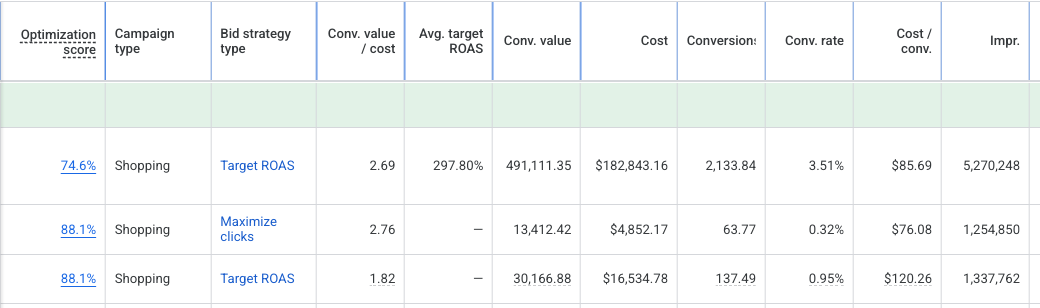
Google Ads · campaign capture, Oct 16, 2026
$491,111.35 in conversion value on one Shopping campaign.
2.69× conversion value / cost, with $182,843.16 in spend.
The three displayed Shopping rows show costs per conversion of $85.69, $76.08, and $120.26. Conversion counts are fractional and are not verified unique new customers. The screenshot does not display its date range.
Meta Ads · Sep 16–Oct 15, 2026
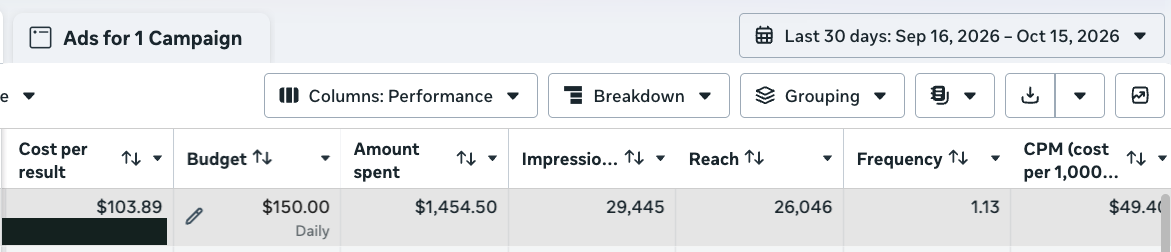
$103.89 per tracked conversion event.
A $1,454.50 spend snapshot with 29,445 impressions.
This is a custom event reported by the platform. Its underlying customer definition is not established by the screenshot, so it is not presented as verified new-customer CAC. Identifying event code redacted.
Meta Ads · creative-test capture, Oct 16, 2026
Creative tests with visible conversion economics.
$99.99 and $156.62 per event across the two displayed tests.
The crop shows two and six custom events. Different event codes are used; the counts are not combined into a single acquisition metric. The date range is not visible. Identifying codes redacted.
Meta Ads · campaign capture, Oct 16, 2026
622 tracked events. $78,035.04 in spend.
A scaled Meta campaign reporting $125.46 per event.
A second row reports 57 events at $100.25 each, and a third reports one at $87.49. These are custom conversion events. This overlaps the closer crop below and is not additional performance. The period is not visible in the supplied crop.
Meta Ads · alternate crop, Oct 16, 2026
A closer look at the same campaign economics.
622 events at $125.46. A second row at $100.25 per event.
This is a second crop of the same 622-event and 57-event rows. Included for readability, not counted as another result. Identifying event codes redacted.
ORGANIC & AI SEARCH
Build demand beyond the paid click.
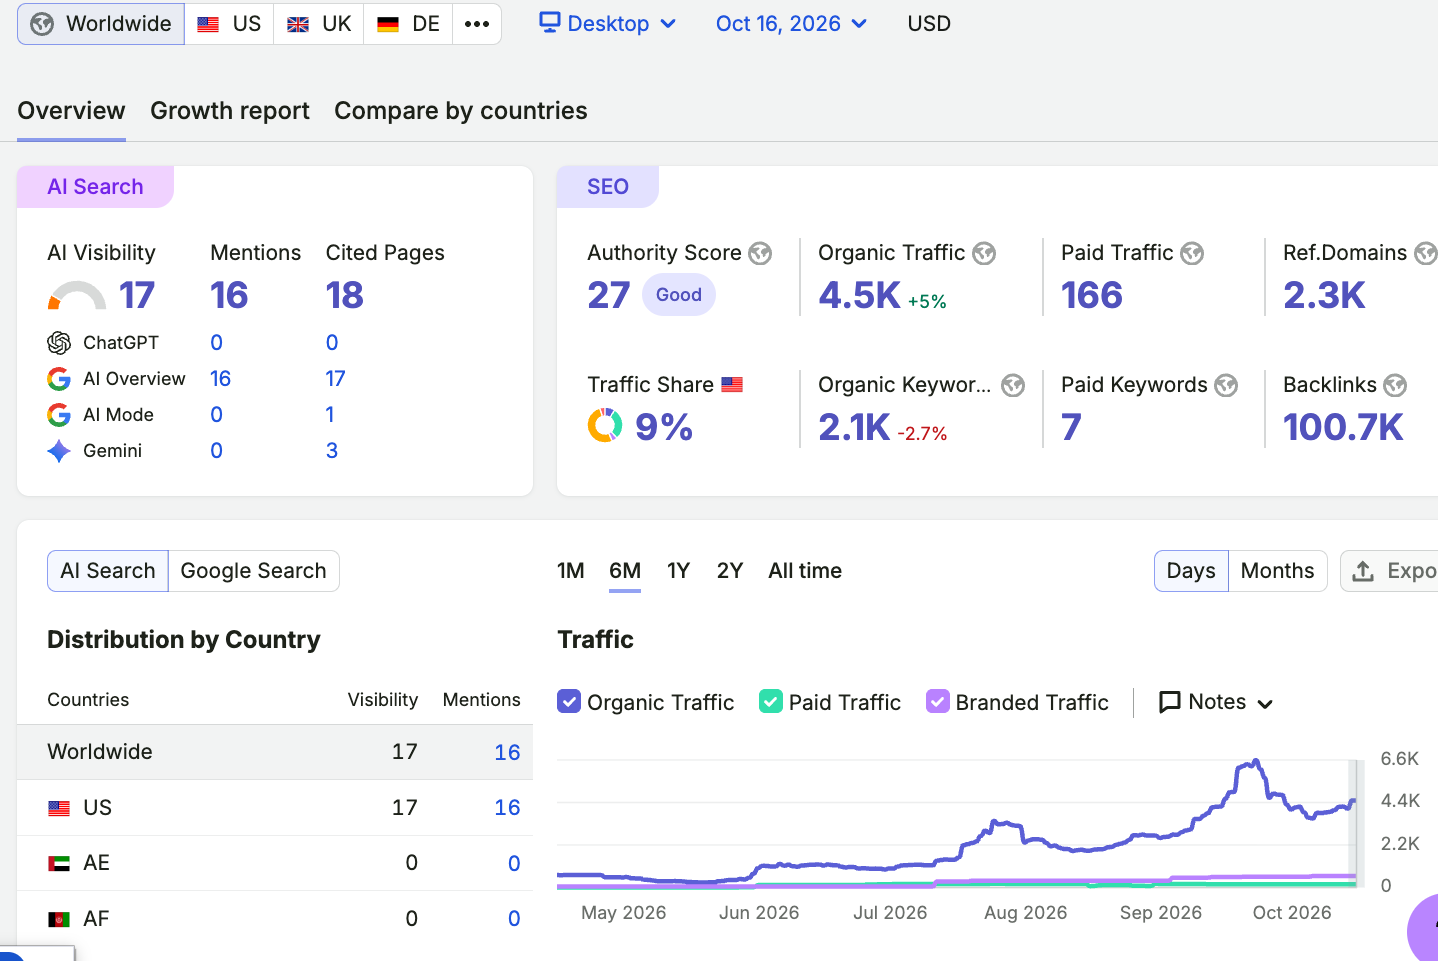
Semrush · worldwide desktop · Oct 16, 2026
4.5K estimated monthly organic visits.
Organic search growth for an anonymized research-use-only peptide business.
The six-month trend and 2.1K organic keywords are visible. Justin describes an earlier baseline of approximately 200 monthly visits in the walkthrough. Semrush traffic is an estimate, not a first-party analytics count. This is a research commerce example, not a telemedicine patient-acquisition claim.
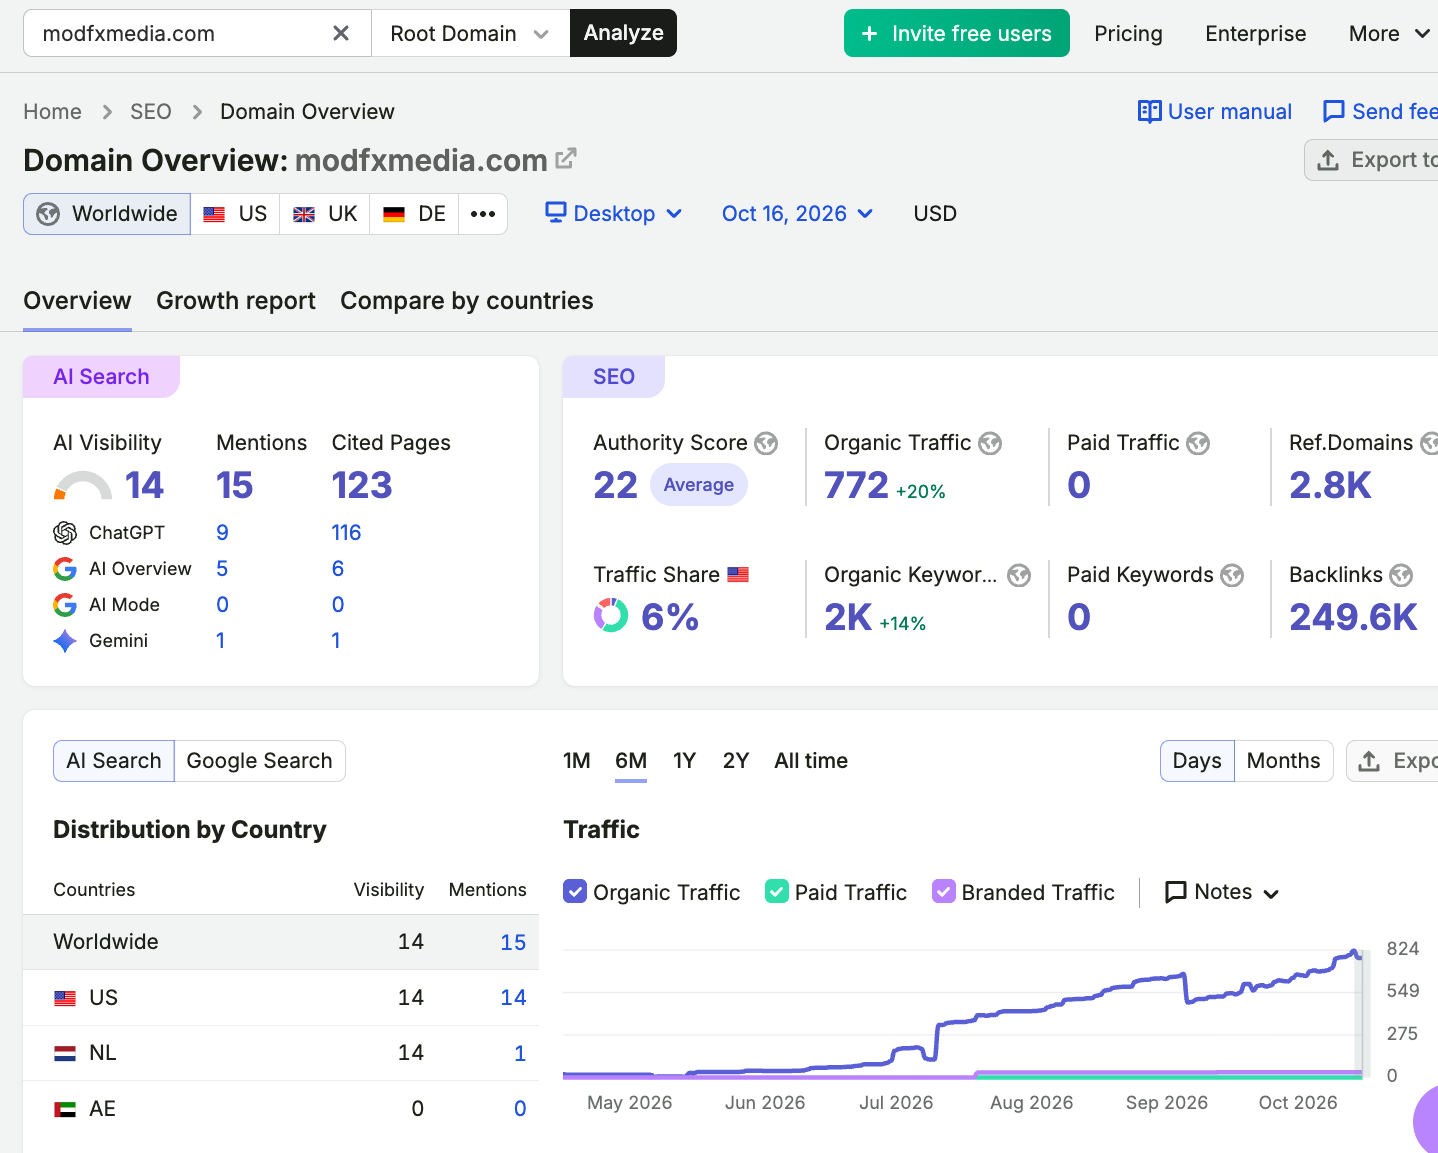
Semrush · ModFX Media · worldwide desktop · Oct 16, 2026
123 cited pages. Organic visibility building.
Justin’s own agency: 2K organic keywords and 772 estimated monthly visits.
The dashboard reports 15 AI-search mentions and 123 cited pages. This is an agency-owned example, separate from the anonymized client results. Semrush visibility and traffic are third-party estimates.
HISTORICAL MEDIA SCALE
Experience at meaningful spend.
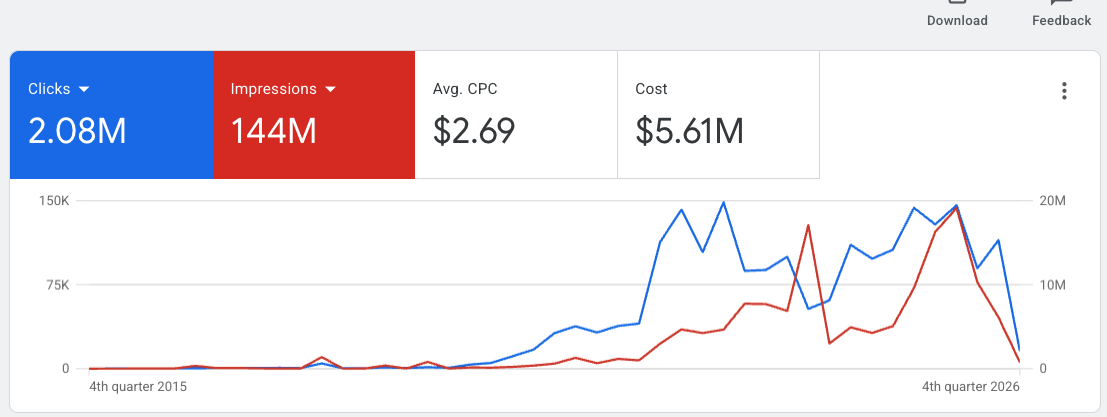
Google Ads · chart spans Q4 2015–Q4 2026
$5.61M in recorded Google Ads spend.
2.08M clicks and 144M impressions in the displayed historical view.
This is one supplied historical account view. It demonstrates media scale, not revenue, profit, or a claim that Justin personally managed every dollar across the entire chart. Rounded values appear as displayed.
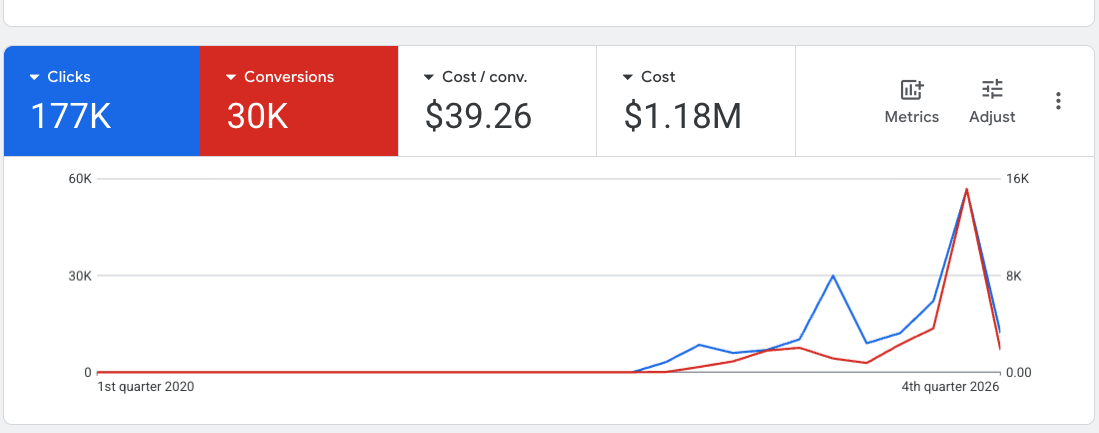
Google Ads · chart spans Q1 2020–Q4 2026
30K recorded conversions. $39.26 per conversion.
$1.18M in recorded spend in the displayed Google Ads view.
The dashboard shows 177K clicks and rounded conversion and cost totals. Conversion actions may include more than one type of event; 30K is not a claim of 30K unique clients. Do not sum this spend with other account views.
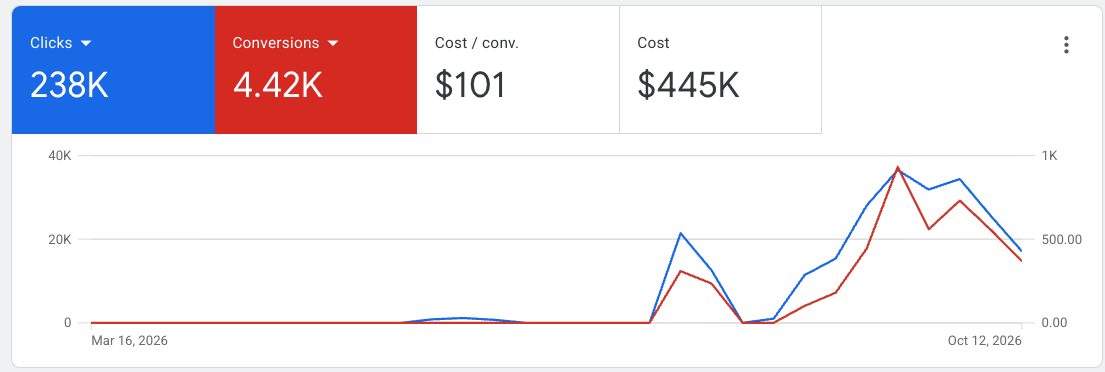
Google Ads · chart labels Mar 16–Oct 12, 2026
4.42K recorded conversions at $101 each.
$445K in spend and 238K clicks in the displayed Google Ads view.
Rounded platform-reported figures. The conversion definition is not shown; these are not independently verified patient or new-customer counts. This view may overlap other supplied Google Ads evidence.
ACQUISITION IS ONLY HALF THE PICTURE
KNOW WHAT A NEW CUSTOMER REALLY COSTS.
A returning buyer should never hide the cost of acquiring someone new.
I set up end-to-end attribution and tracking, typically with tools such as Wicked Reports, so we can separate first-time customers from repeat purchases and evaluate the channels driving each.
That connects paid media, organic search, email, the funnel, and the purchase history to a useful commercial view—not just the numbers inside an ad platform.
New-customer acquisition costDefine the first purchase, deduplicate customers, and separate new and returning buyers.
Channel contributionCompare paid, organic, email, and other sources within a consistent attribution model.
Customer value over timeReview repeat purchases, retention, and payback alongside acquisition cost.
Measurement depends on the connected data, consent, and attribution model. Patient or sensitive health information does not belong in advertising-platform events.
PUT THE EXPERIENCE TO WORK
YOUR NEXT CHAPTER. LET’S BUILD IT.
Telemedicine experience since 2020. A decade in medical marketing. Senior leadership that stays close to the work.
Can I add together the figures in the results library?+
Not necessarily. Some screenshots are different views of the same reporting period or campaign, and some images repeat a closeup of an existing row. Case notes identify these overlaps. Platform conversions, new customers, appointments, revenue, and estimated traffic are different measures and should not be combined into one total.
Will my business achieve the same acquisition cost or return?+
A published result describes a particular reporting view or engagement, not a guaranteed outcome. Your offer, market, conversion journey, margins, retention, and operating capacity affect the economics. We use your baseline and an agreed measurement plan to decide what a useful test and an allowable acquisition cost look like.
 View full-size evidence